Pie Charts in Power BI: How to Group Into Top 3 + Others with DAX
How to turn a pie chart with too many slices into Top 3 + Others in Power BI, using a helper table, a ranking measure and a grouped sales measure in DAX.
Quick summary
A pie chart with lots of slices turns into a colorful blur: nobody can read it. The way out is to show only the main items and lump the rest into a slice called Others. Here we do that with DAX, highlighting the Top 3 and grouping everything else.
There are five steps:
- Create a helper table with the products plus an “Others” row.
- Relate that table to the original one.
- Create a ranking measure.
- Create a measure that returns the sales of each Top 3 item and, for “Others”, the sum of everything else.
- Swap the chart value for that measure.
The problem with pies that have too many slices
Pie and donut charts work well for showing two or three parts of a whole. Beyond that, it gets hard to compare slice sizes, labels pile up and the legend grows until it doesn’t fit. That’s why many people consider it bad practice to use these charts with more categories than that.
The example in this article is a sales-by-product chart with toy products. In the original pie, the labels overlap and it’s impossible to tell at a glance which product sells the most. With the Top 3 and the rest grouped, the reading changes: three names stand out and everything else sits in a single slice.
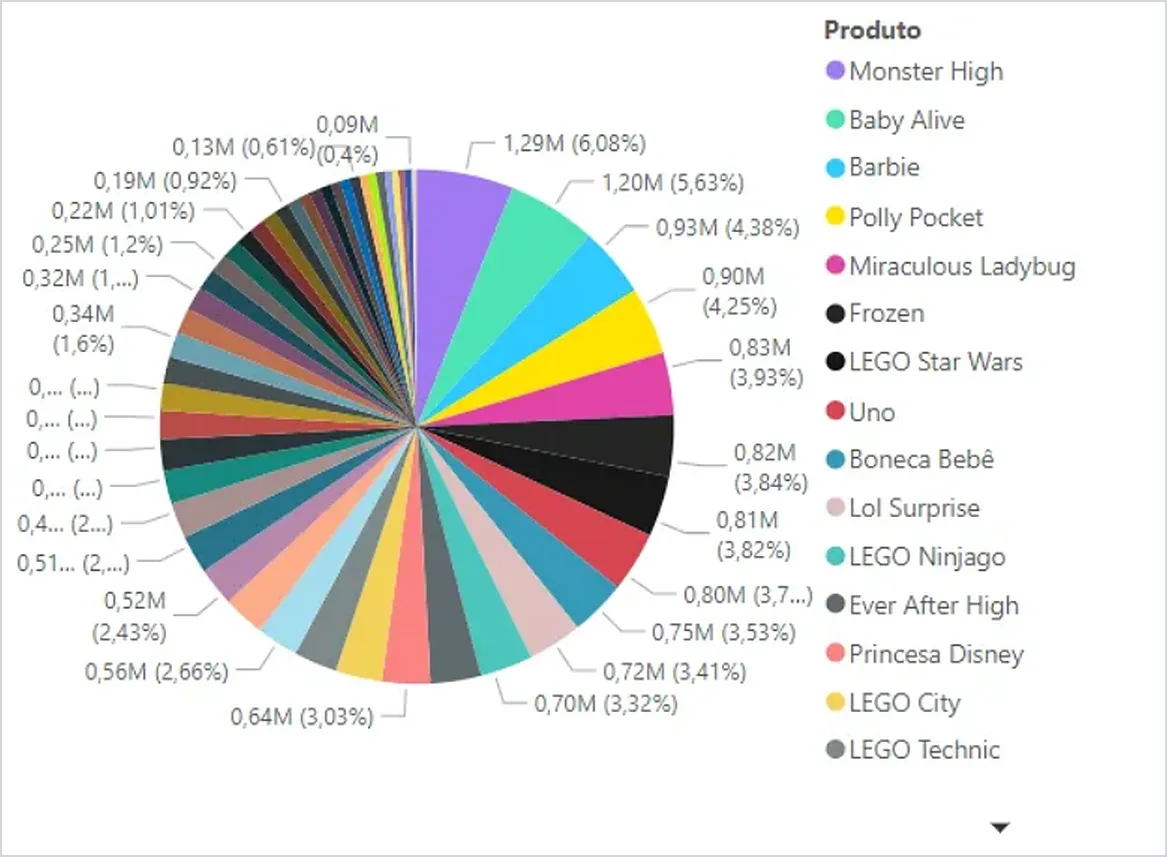
Pie chart with all products: slices and labels overlap and the legend doesn’t fit.
The technique answers a simple question: which few items do I want to highlight, and what can I group without losing the meaning of the analysis?
The solution in five steps
The names below come from the example model, translated to English: the original table is dProducts, the sales measure is [Total Sales] and the new table is called Product. Swap in the names from your own model.
1. Create the helper table
We need a table with all the products plus one extra row called “Others”. You can build it with DAX, in a calculated table:
Product =
UNION(
    VALUES(dProducts[Product]),
    ROW("Product", "Others")
)
VALUES makes sure each product shows up only once. Since this is a dimension table, the performance impact tends to be small. If you prefer, create the table in the query or in SQL, before bringing the data into Power BI.
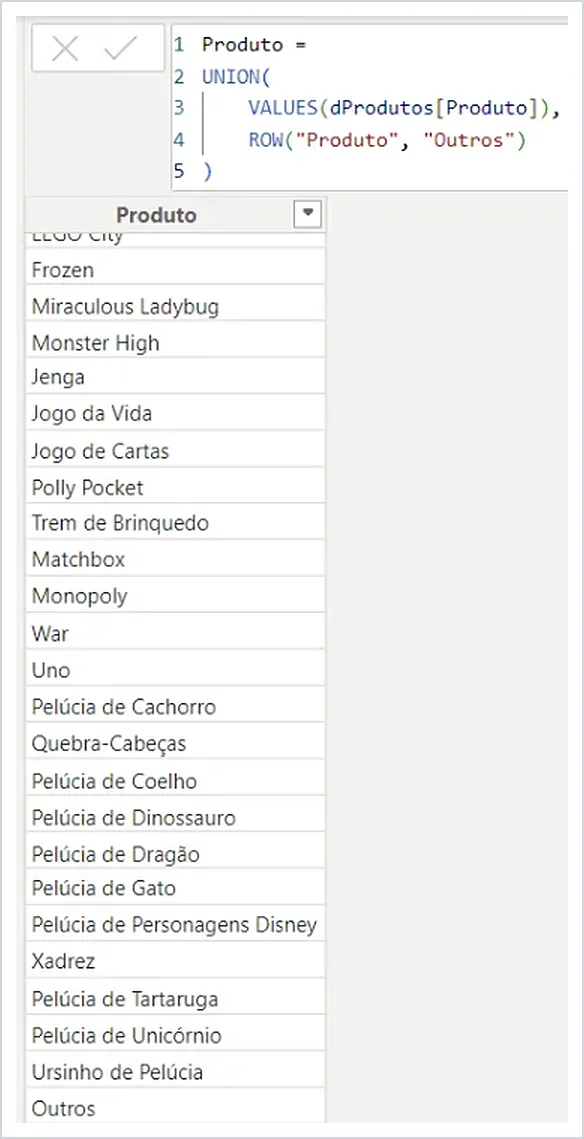
The helper table: the products and, at the end of the list, the “Others” row. The original model is in Portuguese, so the row appears as “Outros” here.
2. Relate it to the original table
Relate the Product column of the new table to the Product column of the original table (dProducts). Check the cardinality and the filter direction in your model.
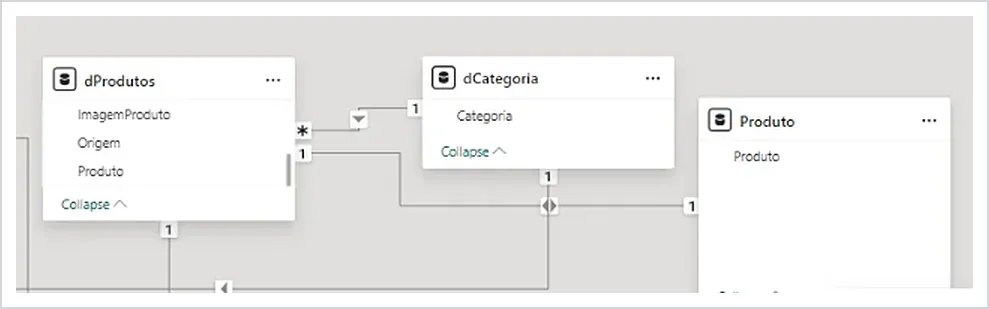
In the example model, the new table (Produto here) is related to dProdutos through the Produto column.
3. Create the ranking measure
Product Ranking =
RANKX(
    ALL(dProducts),
    [Total Sales]
)
The measure ranks products by sales, from highest to lowest: the best seller gets rank 1.
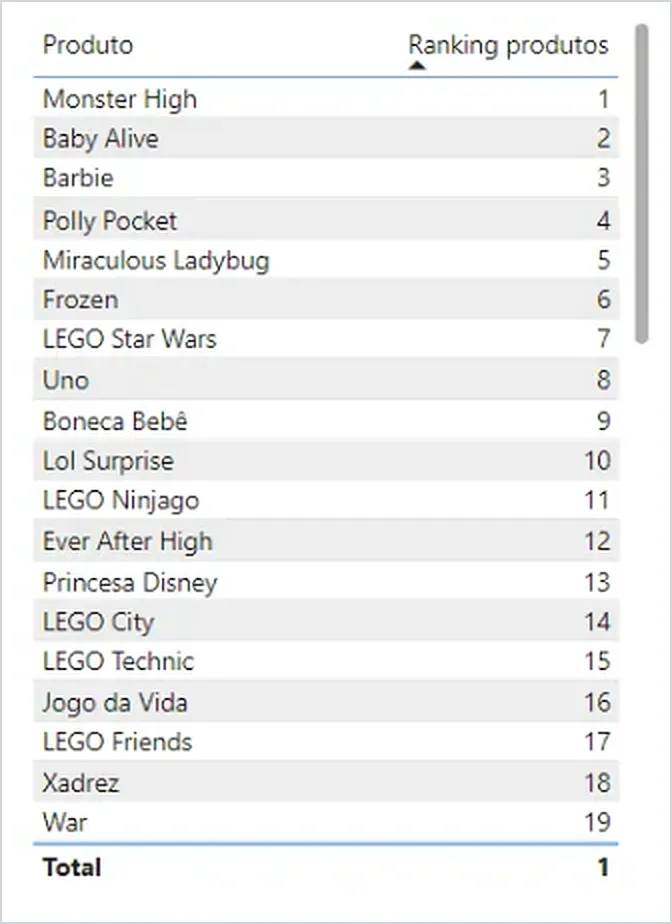
Ranking by sales: the best seller, Monster High, gets 1.
4. Create the grouped sales measure
Grouped Product Sales =
VAR IsOthers = SELECTEDVALUE(Product[Product]) = "Others"
VAR OthersTotal =
    IF(
        IsOthers,
        SUMX(
            FILTER(
                ALL(Product[Product]),
                [Product Ranking] > 3
            ),
            [Total Sales]
        )
    )
RETURN
    IF(
        [Product Ranking] <= 3,
        [Total Sales],
        OthersTotal
    )
In the next section I explain how this measure thinks.
5. Swap the chart value
In the pie or donut chart, put the Product column from the new table in the legend (that’s where the “Others” row lives) and drop the Grouped Product Sales measure into values, in place of [Total Sales].
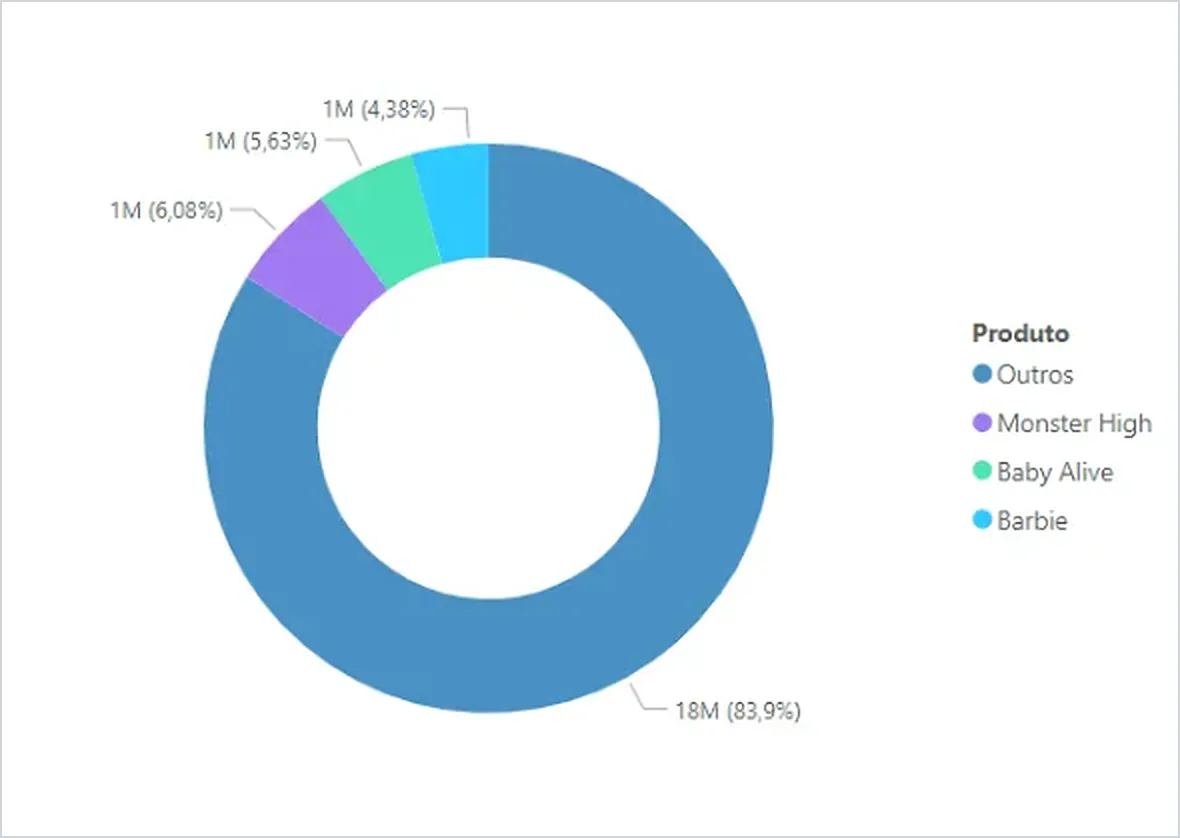
The result: a donut with the Top 3 products and the “Others” slice (shown as “Outros” in the Portuguese-language model).
How the measure works inside
For each slice of the chart, the measure answers a question: “am I in the Top 3, am I Others, or neither?”
The IsOthers variable uses SELECTEDVALUE, which returns the column value when the context has exactly one distinct value and blank otherwise. That’s why it is only true on the “Others” slice.
The OthersTotal variable only calculates anything when IsOthers is true: the sum of sales for every product ranked outside the Top 3. ALL removes the slice’s filter so the measure can see every product, and FILTER keeps only those outside the Top 3. On the other slices the IF has no “else” branch, so it returns blank.
The RETURN ties it all together and lands in one of these cases:
- Product ranked 3 or better: returns its sales.
- The “Others” row: returns
OthersTotal, the sum of everything left out. - Product outside the Top 3: returns
OthersTotal, which on that slice is blank, so it disappears from the chart.
One point worth testing in your model: the “Others” row doesn’t exist in the original table, so its ranking depends on how RANKX handles that case. In the example it falls outside the Top 3 and receives the sum, which is what the final chart shows.
Watch-outs with the result
“Others” can dominate the chart. In the example, the “Others” slice ended up with 83.9% of the total, against 6.08%, 5.63% and 4.38% for the three highlighted products. That’s not a measure error, it’s what the data says, but it changes the reading: the Top 3 weighs little next to the rest. If “Others” ends up with most of the total, ask yourself whether cutting at 3 is the right call.
Pie or donut? I prefer the donut here because it looks cleaner, but that’s a matter of taste. What matters is that the chart has few slices.
If the goal is to compare many items against each other, the Top + Others technique helps, but a bar chart usually works better than any slice.
The technique isn’t just for pies. The same grouping works for other visuals, because the logic lives in the measure, not in the chart type.
Frequently asked questions
How do I change from Top 3 to Top 5? Swap the number 3 in both places of the grouped sales measure: the > 3 inside FILTER and the <= 3 in the RETURN. If you change only one, the numbers stop adding up.
Why do I need the helper table? The chart only shows categories that exist in a column. The helper table creates the “Others” row so it can appear in the legend.
Can I use a different name instead of “Others”? Yes. Change the name in the helper table and also in the comparison inside the IsOthers variable, otherwise the measure won’t find the slice.
What if I want to rank by another measure, like profit? Replace [Total Sales] with your measure in the ranking and in the “Others” sum. The rest of the logic is the same.
Conclusion
A pie with too many slices can’t be read; the way out is to highlight what matters and group the rest. With a helper table, a ranking measure and a grouped sales measure, Power BI builds the Top 3 + Others on its own, and changing the cutoff takes a single number.
Sources
Related video
Prefer to see it in practice? In the video Gráfico de Pizza no Power BI: Como Agrupar em “Top 3 + Outros” (DAX) I build this step by step directly in Power BI. The video is in Portuguese.